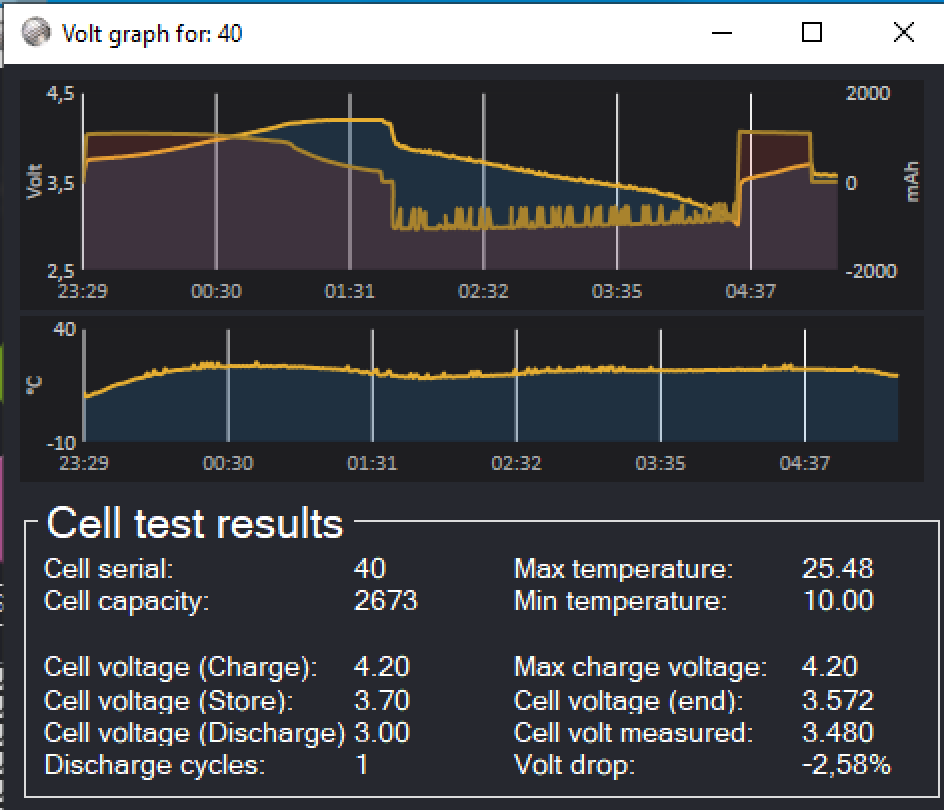
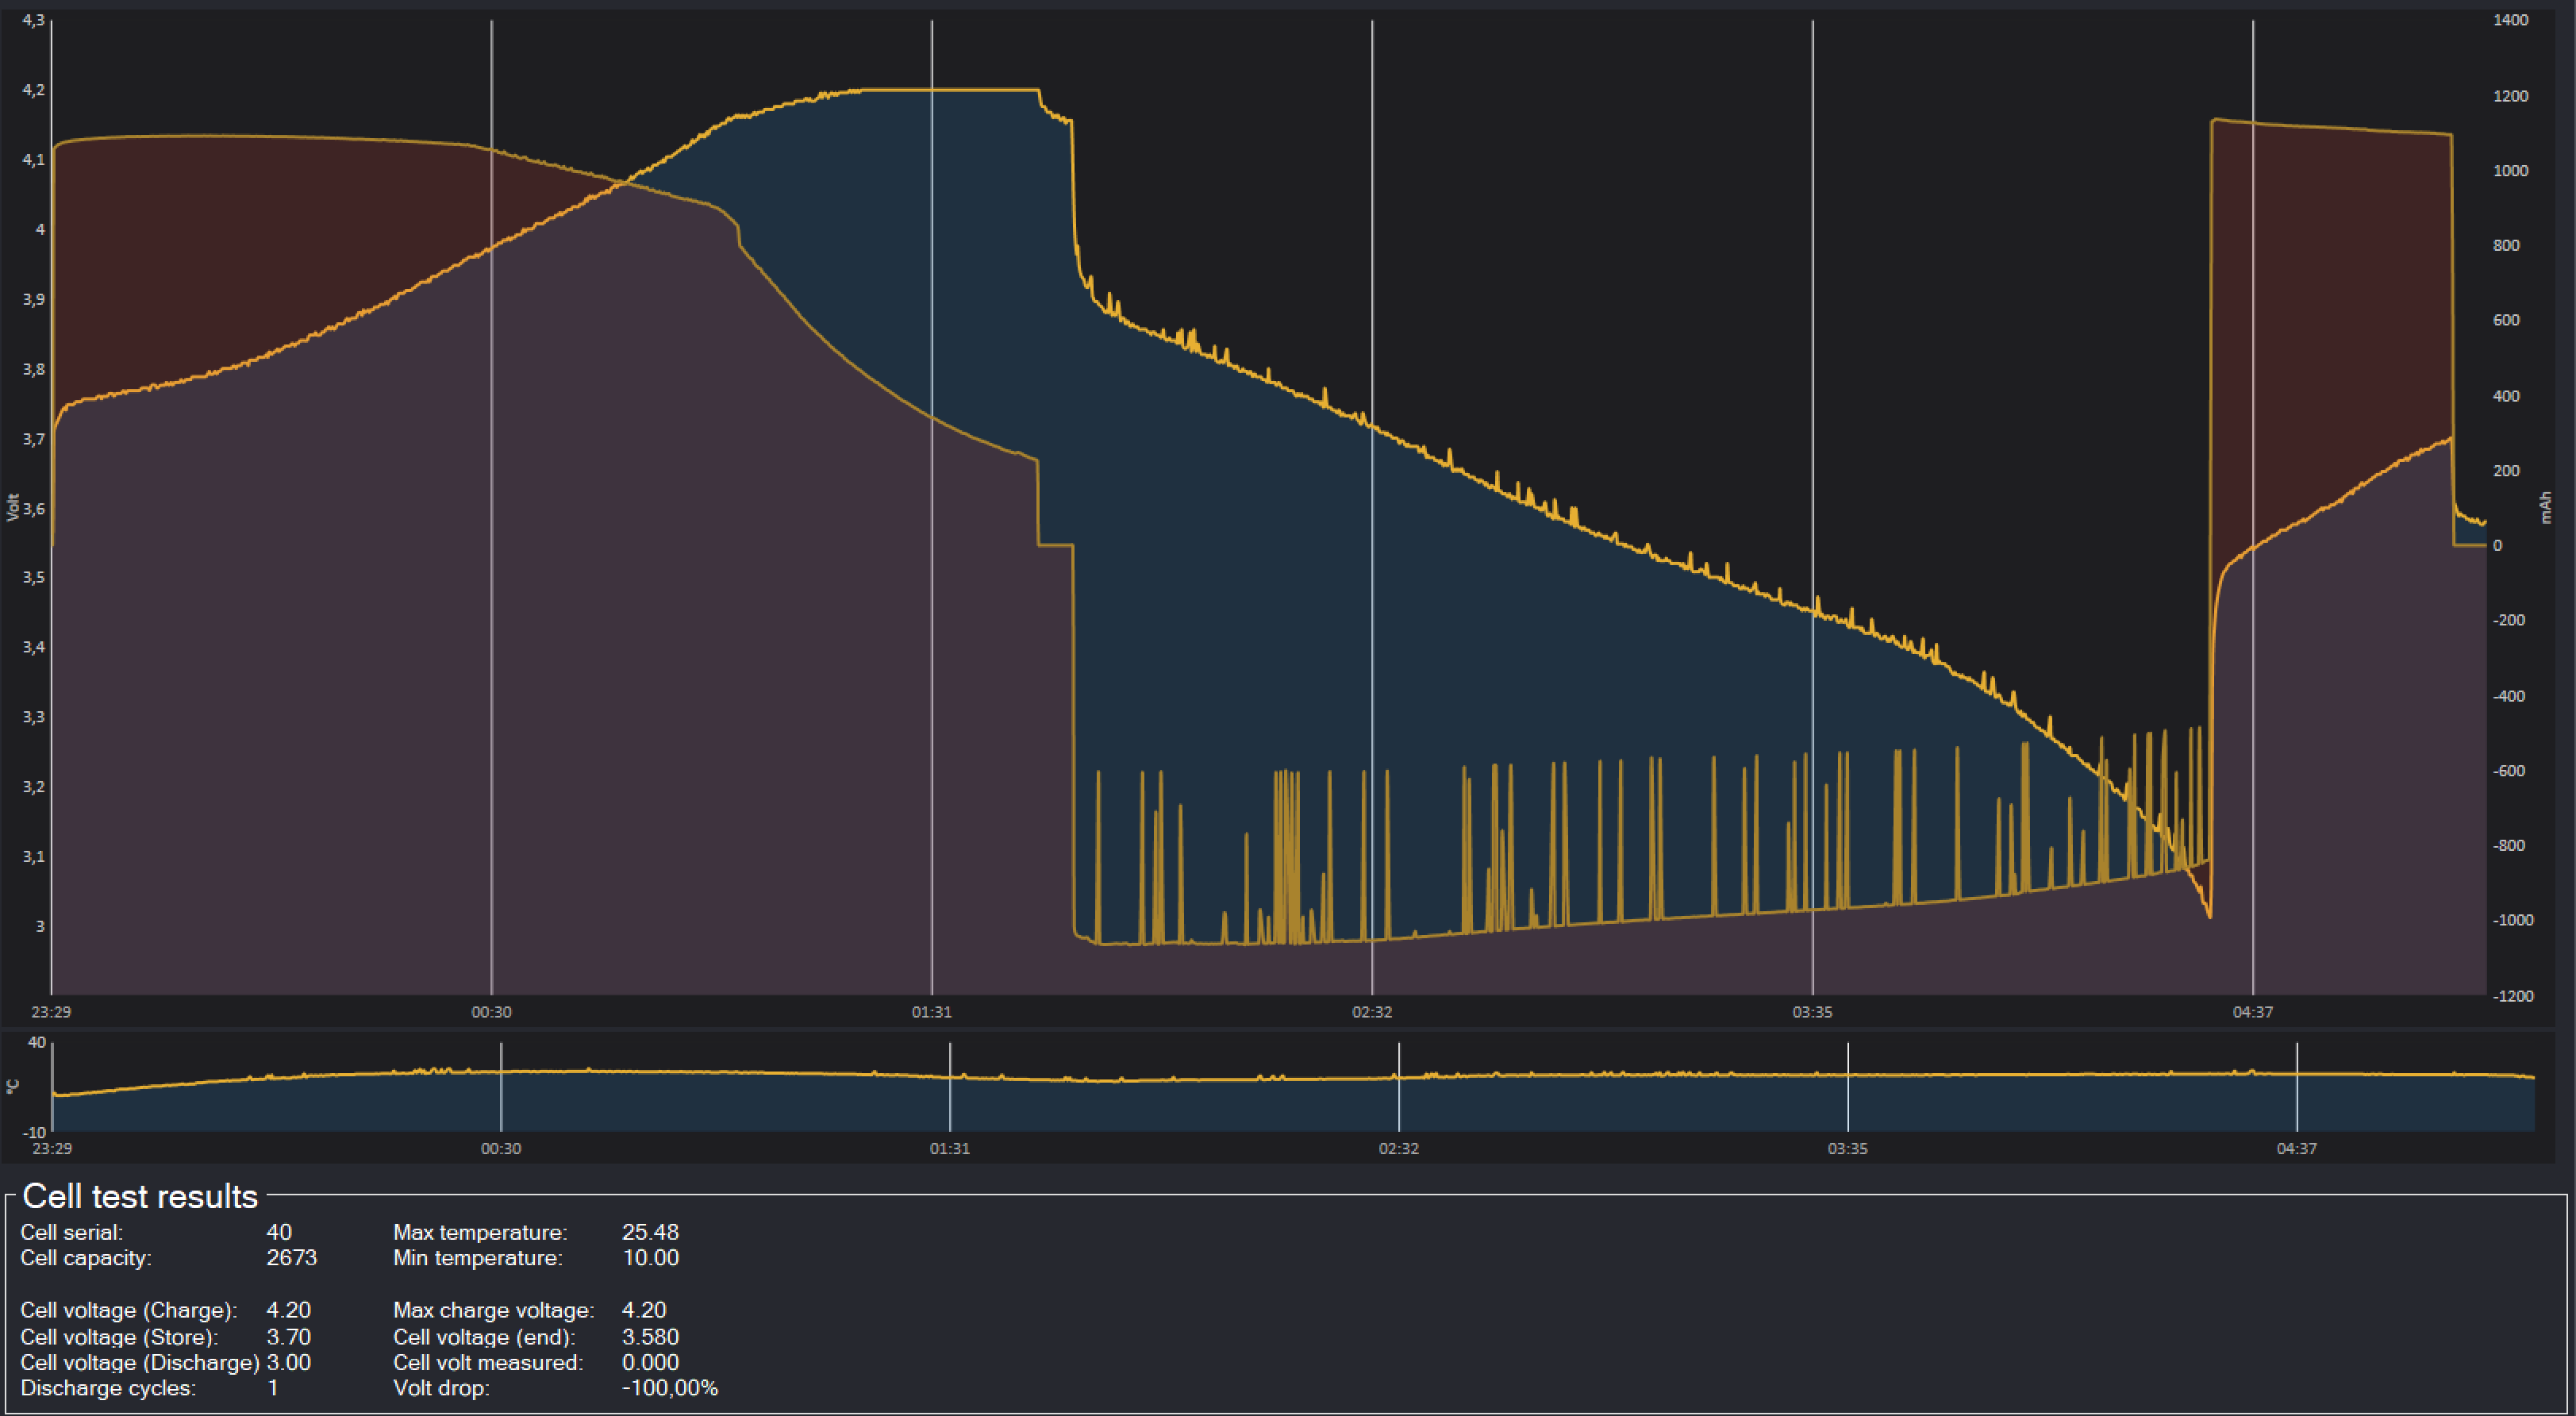
Charge curves
All information is collected in a database and can be visualized in a graph. Graphs improve the speed of analyzing cell behavior duringthe charge cuver or complext workflow operations. Rest moments in workflows allow for volt drops to be visualized or post discharge see what the volt jump up is. Low and high resistance cells behave differently under load which is easily identified in the graphs.Temperature measurements are plotted below the volt graph to create a holistic view between temperature changes during charge- and discharge-cycles.
Volt drop recording
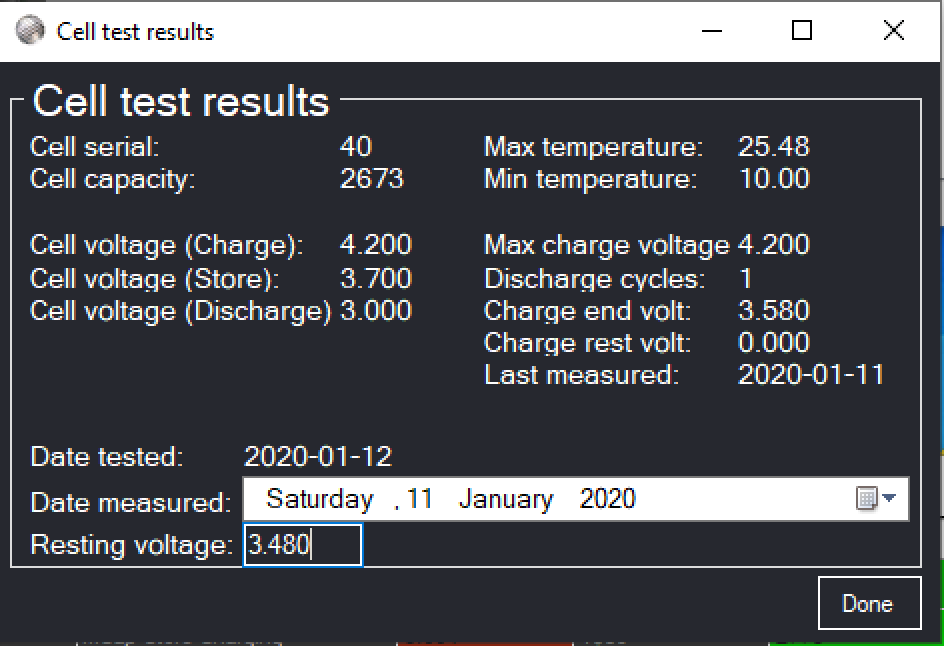 Post capacity test procedure the cells are normally stored for 2 or more weeks to validate if there is any voltage drops. Once the resting period is completed the volt values can be recoeded in the MegaCellMonitor and the volt drop percentage is calculated. This information is stored in teh graps and is visible in the legenda area of the charts.